
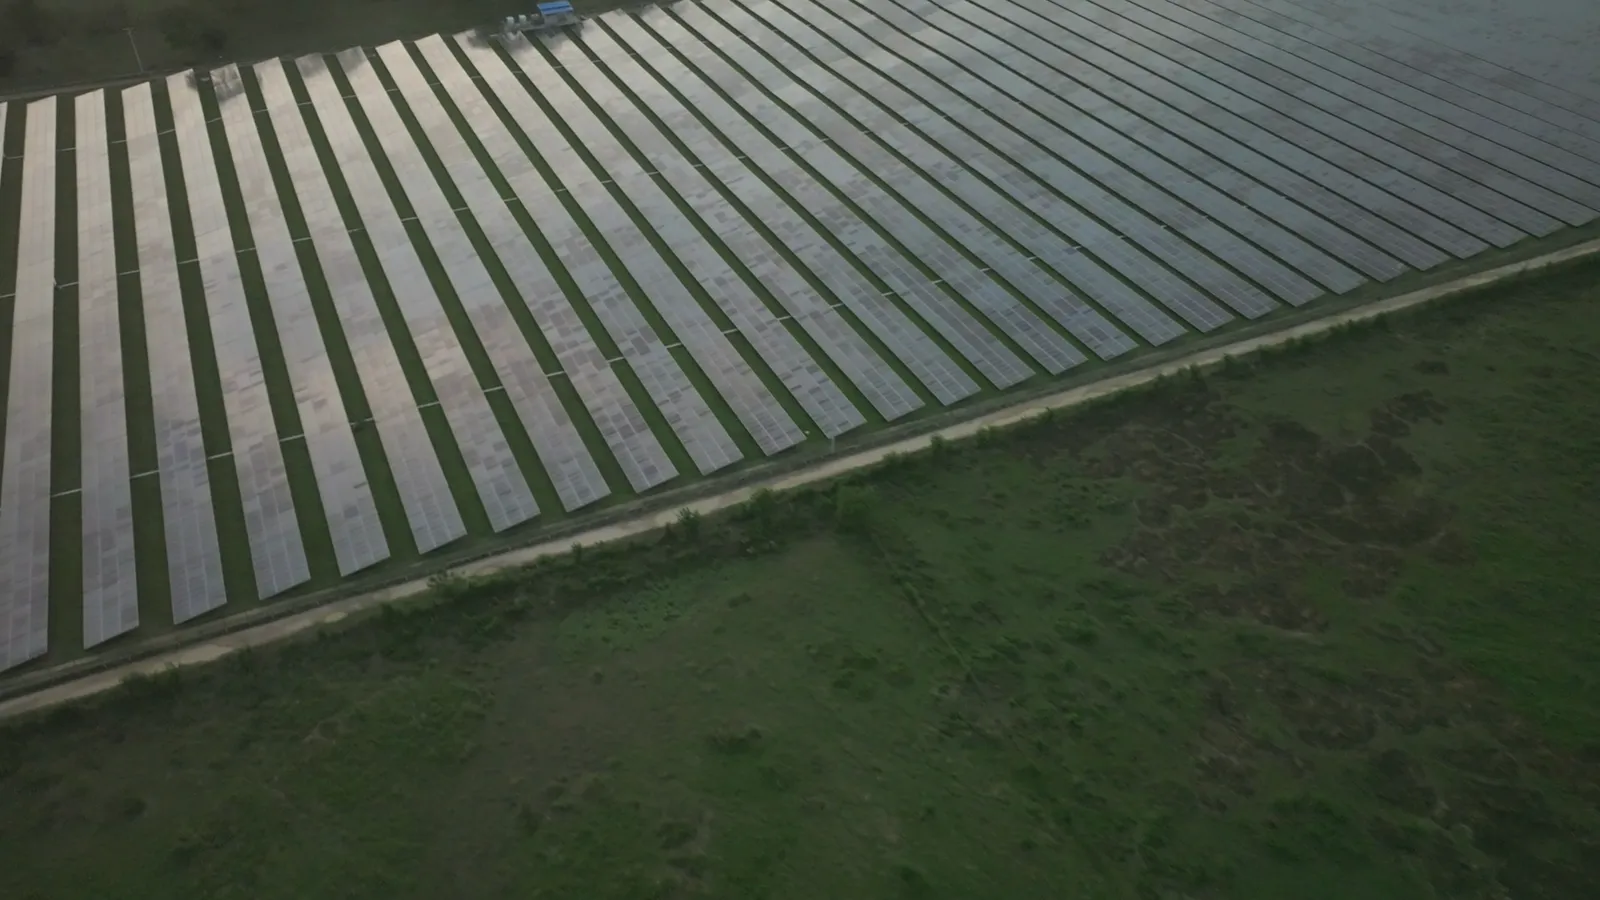
Utility-scale photovoltaic field

INDUSTRYNORTH / Utility solar

Find the energy your site is leaving behind.

Know which assets deserve attention, what the lost energy is worth, and which action to investigate first.

REAL OPERATIONS · LICENSED ILLUSTRATIVE FOOTAGECredits ↗

01 / THE CORE PACKAGE

A clear foundation. Value you can assess.

Start with the assets and data that matter. We agree on scope and success criteria before building.

INCLUDED WITHIN THE AGREED SCOPE

Utility solar
Core analytics

  • 01Expected production for each inverter
  • 02ML models for instrumented combiner boxes
  • 03Persistent underperformance and estimated energy impact
  • 04Prioritized findings with supporting evidence

Data assessment, model validation, and delivery into your tools: Power BI, Tableau, custom applications or CMMS.

Extend where it makes sense.

Optional modules selected for value and data readiness.

+

Soiling trends and cleaning economics

+

Tracker and recurring-shading classification

+

Generation forecasts and thermal-image analysis

+

Degradation and warranty evidence

Data and technical scope

Inverter power, DC voltage/current, irradiance, temperature, plant topology and operating states. Combiner models require measurements mapped to each box.

Diagnosis follows the available measurement level. Inverter totals cannot identify an unmeasured string. Model training excludes known faults, clipping and curtailment.

02 / WHAT A FINDING LOOKS LIKE

Find the missing current

CB-14 delivers 12% less current than its illustrative expected profile. Comparable boxes stay close to baseline.

ILLUSTRATIVE EXAMPLE · NOT A CLIENT RESULT
CB-14 loses current across the daylight curveILLUSTRATIVE DATA
CB-14 loses current across the daylight curve018.53755.473.9A06:0012:0018:00Time
ExpectedObserved
18:00 · Expected: 6 A · Observed: 5.3 A

Synthetic measurements and an illustrative expected profile. Select a point to inspect its values.

View the data
TimeExpected (A)Observed (A)
06:00108.8
07:002219.4
08:003631.7
09:004842.2
10:005851
11:006456.3
12:006658.1
13:006355.4
14:005649.3
15:004539.6
16:003228.2
17:001815.8
18:0065.3
One box stands apart from its peersILLUSTRATIVE DATA
One box stands apart from its peers%CB-0199.5CB-02100.1CB-03100.1CB-0499.6CB-0599CB-0698.8CB-0799.3CB-08100CB-09100.2CB-1099.8CB-1199.1CB-1298.8CB-1399.1CB-1488CB-15100.2CB-16100Combiner box
ExpectedObserved
CB-16 · Expected: 100 % · Observed: 100 %

Observed / expected current at comparable conditions. Aggregate box data does not identify a specific string.

View the data
Combiner boxExpected (%)Observed (%)
CB-0110099.5
CB-02100100.1
CB-03100100.1
CB-0410099.6
CB-0510099
CB-0610098.8
CB-0710099.3
CB-08100100
CB-09100100.2
CB-1010099.8
CB-1110099.1
CB-1210098.8
CB-1310099.1
CB-1410088
CB-15100100.2
CB-16100100

03 / FROM EVIDENCE TO DECISION

Watch the AI workflow unfold.

Explore each stage. See the sources, the proposal, and the point where your team decides.

OPERATIONS INTELLIGENCESIMULATION
YOUR DATA. YOUR TEAM IN CONTROL.
CB-14

Find the missing current

12%illustrative current deficit
01

A signal worth investigating.

CB-14 delivers 12% less current than its illustrative expected profile. Comparable boxes stay close to baseline.

CB-14 loses current across the daylight curveILLUSTRATIVE DATA
CB-14 loses current across the daylight curve018.53755.473.9A06:0012:0018:00Time
ExpectedObserved
18:00 · Expected: 6 A · Observed: 5.3 A

Synthetic measurements and an illustrative expected profile. Select a point to inspect its values.

0:00 / 0:40

Illustrative data · sample documents · simulated workflow. These are not client results.

Read the complete story

Find the missing current

CB-14 delivers 12% less current than its illustrative expected profile. Comparable boxes stay close to baseline.

The current deficit persists across the daylight curve [1]. Peer measurements make a site-wide weather change less likely. Review connections and inspection evidence [2]; the model has not confirmed a failed component.

  1. Attach current trend and peer comparison
  2. Request targeted inspection using the approved procedure
  3. Compare post-inspection behavior with the baseline

An evidence pack is ready for a targeted inspection.

Explore all 10 AI workflows ↗

04 / MANAGED ANALYTICS

A useful model needs care.

Equipment changes. Sensors drift. Operations evolve. We keep models aligned with that reality.

See model care in action ↗
  1. 01Monitor data quality and model drift
  2. 02Investigate changes before retraining
  3. 03Validate on held-out periods and known events
  4. 04Review versions, deployment and rollback
  5. 05Incorporate engineering feedback